Tech | ||
| Capacity (MW) | ||
| 1. | 3,588.1 | |
|---|---|---|
| 2. |  Amazon Amazon |
1,114.5 |
| 3. | 987.3 | |
| 4. | 550.6 | |
| 5. | 234.0 | |
Retail | ||
| Capacity (MW) | ||
| 1. | 688.9 | |
|---|---|---|
| 2. | 515.1 | |
| 3. | 140.0 | |
| 4. | 57.6 | |
| 5. | 53.3 | |
U.S. businesses and top global brands are making historic investments in solar energy. As of June 2022, Meta leads the nation with the most solar capacity installed, followed closely by Amazon, Apple, Walmart and Microsoft. Nearly 19 gigawatts (GW) of solar capacity has been installed with commercial and corporate off-takers, more than half of which has come online since 2020...
SEIA’s ninth Solar Means Business Report tracks solar and energy storage adoption by businesses across the U.S., ranging from some of the country’s largest and most recognizable brands to the small businesses that make up our communities. In addition to the solar systems located on rooftops and at commercial facilities, this report also captures large off-site installations that U.S. companies invest in to power their operations, which now account for 55% of all commercial solar use.
Through June 2022, this report tracks more than 18,500 megawatts (MW) of installed solar capacity across 48,000 projects, representing more than 70% of all commercial solar capacity installed in the U.S.
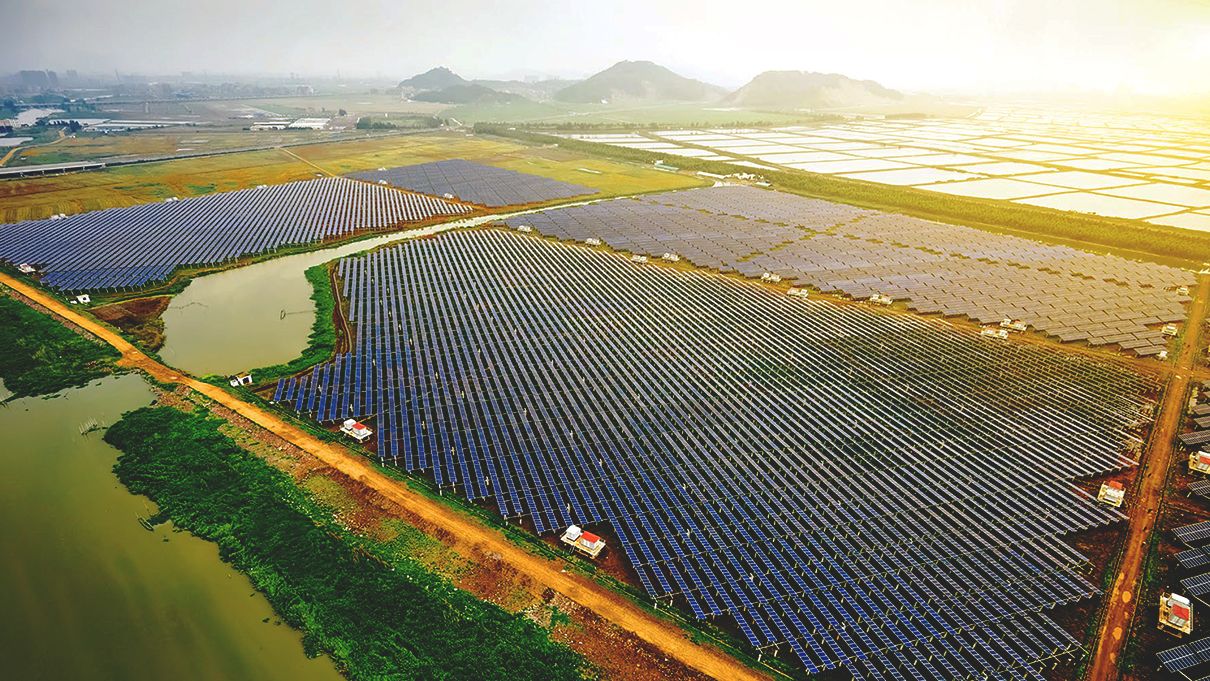
Photo credit: Meta 2021 Sustainability Report

| Installed Capacity (MW) | ||
| 1. | Meta | 3,588.06 |
|---|---|---|
| 2. | Amazon | 1,113.43 |
| 3. | Apple | 987.25 |
| 4. | Walmart | 688.91 |
| 5. | Microsoft | 550.06 |
| Installed Capacity (MW) | ||
| 6. | Target | 515.06 |
|---|---|---|
| 7. | Cargill | 342.00 |
| 8. | Kaiser Permanente | 302.51 |
| 9. | Anheuser-Busch | 300.67 |
| 10. | Evraz North America | 300.00 |
As solar prices have fallen and options for investing in clean energy have expanded, the number of commercial solar installations has grown rapidly across the country. From rooftop systems on local businesses, to solar parking canopies supporting a corporate headquarters, to large off-site installations powering data centers, these projects are as diverse and varied as the companies themselves.
The map below shows every commercial solar installation tracked in this report. The bubble size corresponds with that system’s solar capacity.
Notice something missing? Submit additional data on commercial solar projects to be included in this report.
Access a downloadable version of the Solar Means Business Report, including additional analysis and methodology.
SEIA Members have access to the full Solar Means Business dataset, including detailed project-level information.

Companies invest in solar for many reasons: to power their operations, to meet environmental goals or simply to save money on their electricity bills. The companies tracked in this report are leading the way. Whether it supports data centers and computing, retail and product distribution, or manufacturing, these companies are using solar to move their operations forward.
Use the interactive chart below to see how many of the leading corporate brands in America have increased their investment in solar energy over time.
Corporate solar adoption has expanded rapidly over the past several years, with more than half of all commercial solar capacity installed since 2020. Much of the recent growth can be attributable to the rapid expansion of off-site corporate solar procurement, which now represents 55% of all commercial solar use. More than 70% of all off-site corporate solar has been brought online in the last 2.5 years.The systems tracked in this report generate enough electricity each year to power 3.2 million U.S. homes.
The price to install solar has fallen by 60% in the last decade, though prices have been on the rise over the last 18 months as a result of supply chain challenges and increasing labor costs. Despite this, corporate demand continues to surge with 18 of the top 25 companies ranked in this report pursuing 100% renewable energy or carbon neutral goals. 18 of the top 25 companies in this report have committed to carbon neutrality or a 100 percent renewable energy goal, and 13 have joined the RE 100, an initiative of businesses committed to 100% renewable electricity.
The wide variety of businesses that invest in solar energy excel in various ways. The rankings below tease out business leaders by different sectors and business types, including the tech industry, manufacturing, health care and more.
Tech | ||
| Capacity (MW) | ||
| 1. | 3,588.1 | |
|---|---|---|
| 2. |  Amazon Amazon |
1,114.5 |
| 3. | 987.3 | |
| 4. | 550.6 | |
| 5. | 234.0 | |
Retail | ||
| Capacity (MW) | ||
| 1. | 688.9 | |
|---|---|---|
| 2. | 515.1 | |
| 3. | 140.0 | |
| 4. | 57.6 | |
| 5. | 53.3 | |
Manufacturing | ||
| Capacity (MW) | ||
| 1. | 300.0 | |
|---|---|---|
| 2. | 100.0 | |
| 3. | 91.8 | |
| 4. | 88.9 | |
| 5. | 71.6 | |
Real Estate | ||
| Capacity (MW) | ||
| 1. | 240.7 | |
|---|---|---|
| 2. | 217.4 | |
| 3. | 108.2 | |
| 4. | 97.4 | |
| 5. | 59.5 | |
Food & Beverage | ||
| Capacity (MW) | ||
| 1. | 342.0 | |
|---|---|---|
| 2. | 300.7 | |
| 3. | 197.4 | |
| 4. | 65.0 | |
| 5. | 26.7 | |
Health Care | ||
| Capacity (MW) | ||
| 1. | 302.5 | |
|---|---|---|
| 2. | 110.0 | |
| 3. | 35.0 | |
| 4. | 10.0 | |
| 5. | 8.0 | |
Financial Services | ||
| Capacity (MW) | ||
| 1. | 153.0 | |
|---|---|---|
| 2. | 125.0 | |
| 3. | 36.5 | |
| 4. | 35.0 | |
| 5. | 8.2 | |
Entertainment | ||
| Capacity (MW) | ||
| 1. | 24.0 | |
|---|---|---|
| 2. | 23.4 | |
| 3. | 8.4 | |
| 4. | 5.6 | |
| 5. | 5.0 | |

Commercial solar installation density varies across the country depending on the unique environmental, economic and regulatory characteristics of each state. The top states hit the sweet spot in all three categories, while those looking to catch up are often just a smart policy decision away from realizing the economy-wide benefits solar can bring to the business community.
Corporate Solar Adoption by State (MWdc)